Introduction
Excel is such a powerful tool that almost all companies make extensive use of it for analyzing data. Moreover, the internet is not as it was 10 years ago. Almost all pages that are out there on the internet are dynamic ones, that is, interacts with a database in backend to produce results. Sometimes, data that are displayed, if made available on in an Excel file, proper analysis of the data often helps in making more accurate decisions by using Excel features. In this tutorial, we will learn how to interact with Excel files, both reading and writing.
Excel - ASP.NET Scenarios
For the purpose of this tutorial, an Excel sheet had been prepared that holds record of students and their respective marks in subjects. Please note that these records are fictitious and had been input randomly.
|
StudentId |
StudentName |
|
10001 |
John Thomas |
|
10002 |
Terry Lane |
|
10003 |
Anne Marie |
|
10004 |
Tom Sawyer |
|
10005 |
Derek Ince |
|
10006 |
Emerson Boyce |
|
10007 |
Thommas Kolka |
|
10008 |
Edison Hall |
|
10009 |
Teddy Harewood |
|
10010 |
Williams Yorkshire |
Fig 1. Table holding information for students
|
StudentId |
Marks |
|
10001 |
50 |
|
10002 |
60 |
|
10003 |
75 |
|
10004 |
80 |
|
10005 |
90 |
|
10006 |
95 |
|
10007 |
100 |
|
10008 |
20 |
|
10009 |
48 |
|
10010 |
66 |
Fig 2. Table holding student marks in Mathematics subject
|
StudentId |
Marks |
|
10001 |
30 |
|
10002 |
25 |
|
10003 |
65 |
|
10004 |
78 |
|
10005 |
95 |
|
10006 |
64 |
|
10007 |
32 |
|
10008 |
88 |
|
10009 |
95 |
|
10010 |
99 |
Fig 3. Table holding student marks in Geography subject
Interacting with Excel
Fortunately, there are COM objects that are available to interact with the Excel file. Also, we can make use of the OleDB class to treat the Excel file as a simple table. In this way, we can fire SQL queries to the Excel file so that we can retrieve data from the sheets. An analogy can be made to a database. The Excel Workbook is considered as the Database while the Sheets are considered as tables. Microsoft Excel 11.0 Object Library should be added as Reference to get the features for interacting with Excel.
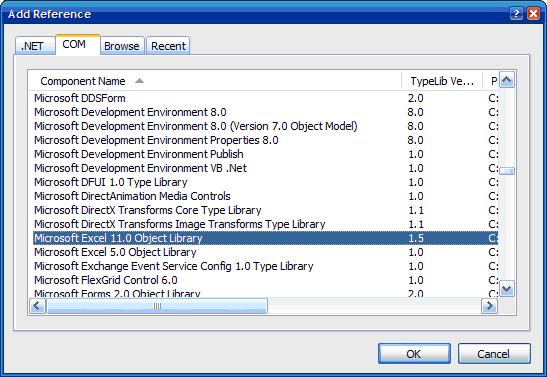
Fig 4. Adding Microsoft Excel 11.0 Object Library as Reference
The Excel file is then added to the DataSource folder in ASAP.NET to be interacted with. To connect to a certain database, a connection string is needed. The same thing applies for Excel. The following is a key added in the Web.Config file for future reference.
<add name="ExcelConnection" connectionString="Provider=Microsoft.Jet.Oledb.4.0;Data Source=|DataDirectory|\SchoolMgt.xls;Extended Properties=Excel 8.0"/>
Note that our Excel file which contains the necessary data will be SchoolMgt.xls, as written in the connection string.
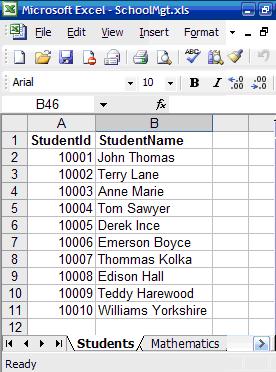
Fig 5. Excel file illustrating Excel Book containing data sheets with data
Reading data from Excel sheets
Let us build an interface for getting data from the Excel file.
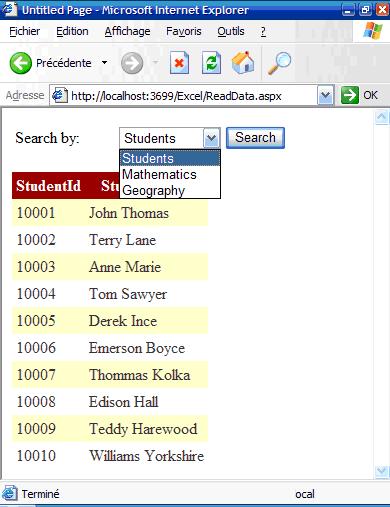
Fig 6. Interface to search records per table selected.
It is important to import the following:
Imports System.Data.OleDb
Imports System.Data
The following code creates the connection and builds the query based on the selected table.
Protected Sub btnSearch_Click(ByVal sender As Object, ByVal e As System.EventArgs) Handles btnSearch.Click
Try
Dim strExcelConn As String = System.Configuration.ConfigurationManager.ConnectionStrings.Item("ExcelConnection").ToString()
Dim dbConn As New OleDbConnection(strExcelConn)
Dim strSQL As String
strSQL = "SELECT * FROM [" & cmbSheets.SelectedItem.ToString() & "$]"
dbConn.Open()
Dim cmd As New OleDbCommand(strSQL, dbConn)
Dim dsExcel As New DataSet
Dim daExcel As New OleDbDataAdapter(cmd)
daExcel.Fill(dsExcel)
dgResults.DataSource = dsExcel
dgResults.DataBind()
Catch ex As Exception
Throw ex
End Try
End Sub
Please note that the table name in the SELECT query should be in the format [TableName$], which the square brackets and the dollar sign at the end.
Playing with SELECT statements
As you have guessed, the Excel file has turned out to be a normal database. The transparency that the OleDB connection had made is exceptional. Also, note that the first row is taken to contain field names for the columns.
Now, let us get the marks of the students in Mathematics, Geography and Total, sorted in Descending order.
Protected Sub btnGenerateReport_Click(ByVal sender As Object, ByVal e As System.EventArgs) Handles btnGenerateReport.Click
Try
Dim strExcelConn As String = System.Configuration.ConfigurationManager.ConnectionStrings.Item("ExcelConnection").ToString()
Dim dbConn As New OleDbConnection(strExcelConn)
Dim strSQL As String
strSQL = "SELECT S.StudentId, S.StudentName, M.Marks, G.Marks, (M.Marks+G.Marks) AS Total "& _
"FROM [Students$] S, [Mathematics$] M, [Geography$] G "& _
"WHERE(S.StudentId = M.StudentId And S.StudentId = G.StudentId) " & _
"ORDER BY (M.Marks+G.Marks) DESC"
dbConn.Open()
Dim cmd As New OleDbCommand(strSQL, dbConn)
Dim dsExcel As New DataSet
Dim daExcel As New OleDbDataAdapter(cmd)
daExcel.Fill(dsExcel)
dgReports.DataSource = dsExcel
dgReports.DataBind()
Catch ex As Exception
Throw ex
End Try
End Sub
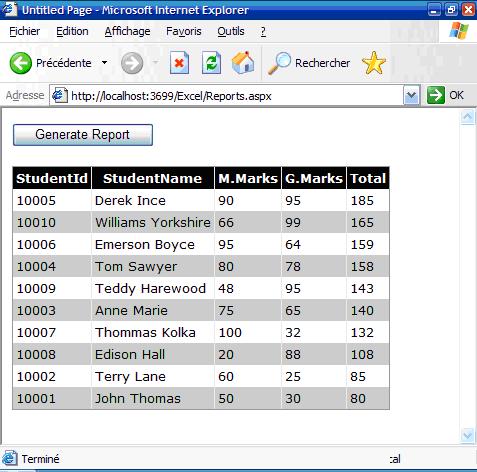
Fig 7. Report generating the students' marks and total, sorted in descending order.
Generating Excel Reports
Two ways for generating Excel report will be discussed in this tutorial. The first one is using the "Response" class and the second one by manipulating the Excel objects that "Microsoft Excel 11.0" Objects provide.
The following piece of code illustrates how this is done
Protected Sub btnToExcelByResponse_Click(ByVal sender As Object, ByVal e As System.EventArgs) Handles btnToExcelByResponse.Click
' Variables declaration
Dim dsExport As New DataSet()
Dim tw As New System.IO.StringWriter()
Dim hw As New System.Web.UI.HtmlTextWriter(tw)
Dim dgGrid As New DataGrid()
dgGrid.DataSource = getData()
' Report Header
hw.WriteLine("<b><u><font size='5'> Student Marking Report </font></u></b>")
' Get the HTML for the control.
dgGrid.HeaderStyle.Font.Bold = True
dgGrid.DataBind()
dgGrid.RenderControl(hw)
' Write the HTML back to the browser.
Response.ContentType = "application/vnd.ms-excel"
Me.EnableViewState = False
Response.Write(tw.ToString())
Response.End()
End Sub
-
First, we create the dataset that will hold the records. Then, a StringWriter object (tw) is also created along with an HtmlTextWriter (hw) which takes as parameter the text writer object. They are important for rendering purposes; i.e. html tags can be applied like bold, italic etc. to the resulting Excel report.
-
Also, a datagrid object which will store the dataset of records.
-
Note that function getData() in the code snippet only contains the codes in the previous example which returns a dataset of records.
-
hw.WriteLine("<b><u><font size='5'> Student Marking Report </font></u></b>") shows that you can also combine HTML codes with the output for proper display. In our example, the font size will be 5, underlined and bold.
-
dgGrid.RenderControl(hw) renders the HTML object with the data that the datagrid contains. The result is normally formatted in a tabular format.
-
Response.ContentType = "application/vnd.ms-excel" makes the Reponse object output to Excel.
-
Response.Write(tw.ToString()) outputs the formatted object to Excel.
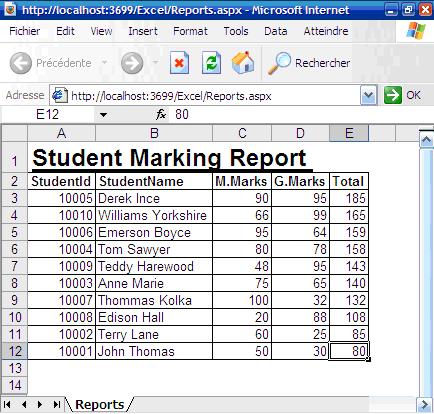
Figure 8. Output result showing the report that is generated in Excel
The second way for generating Excel reports from ASP.NET is to use the Microsoft Excel 11.0 Objects. This method offers more fallibility in terms of manipulating the features that Excel provides and formatting the report.
The following code snippet makes use of the various Excel objects that Excel provides to generate the report.
Imports System.Reflection
Imports Excel = Microsoft.Office.Interop.Excel
Protected Sub btnToExcelByObjects_Click(ByVal sender As Object, ByVal e As System.EventArgs) Handles btnToExcelByObjects.Click
Try
Dim xlWorkBook As Excel.Workbook
Dim xlWorkSheet As Excel.Worksheet
xlWorkBook = New Excel.Application().Workbooks.Add(Missing.Value)
xlWorkBook.Application.Visible = True
xlWorkSheet = xlWorkBook.ActiveSheet
' Gets the dataset containing the data
Dim dsData As DataSet = getData()
Dim i As Integer = 2
' Outputting the fieldnames in pink bold color
xlWorkSheet.Cells(1, 1) = "Student ID"
xlWorkSheet.Cells(1, 2) = "Student Name"
xlWorkSheet.Cells(1, 3) = "Mathematics"
xlWorkSheet.Cells(1, 4) = "Geography"
xlWorkSheet.Cells(1, 5) = "Total"
xlWorkSheet.Range("$A1:$E1").Font.ColorIndex = Excel.Constants.xlColor1
xlWorkSheet.Range("$A1:$E1").Font.Bold = True
' Outputting the data
For Each dr As DataRow In dsData.Tables(0).Rows
xlWorkSheet.Cells(i, 1) = dr(0)
xlWorkSheet.Cells(i, 2) = dr(1)
xlWorkSheet.Cells(i, 3) = dr(2)
xlWorkSheet.Cells(i, 4) = dr(3)
' Building the formula for calculating the sum
xlWorkSheet.Cells(i, 5).Formula = "=SUM($C{0}:$D{0})".Replace("{0}", i.ToString())
' Going to the next row
i = i + 1
Next
' Auto fit the columns
xlWorkSheet.Columns.AutoFit()
' Generating the graph
Dim chart As Excel.Chart
chart = xlWorkBook.Charts.Add()
With chart
.ChartType = Excel.XlChartType.xlColumnClustered
.SetSourceData(xlWorkSheet.Range("A1:E11"), 2)
.HasTitle = True
.ChartTitle.Characters.Text = "Students' marks"
.Axes(1, Excel.XlAxisGroup.xlPrimary).HasTitle = True
.Axes(1, Excel.XlAxisGroup.xlPrimary).AxisTitle.Characters.Text = "Students"
.Axes(2, Excel.XlAxisGroup.xlPrimary).HasTitle = True
.Axes(2, Excel.XlAxisGroup.xlPrimary).AxisTitle.Characters.Text = "Marks"
End With
Catch ex As Exception
Throw ex
End Try
End Sub
An Excel workbook is first created. Then the active sheet is accessed by xlWorkSheet = xlWorkBook.ActiveSheet. After that, we get the data into the dataset, ready to be processed. Using the Font property, the title is displayed in Pink bold colour. Note how the Formula that Excel provides is properly used to calculate the SUM of the marks for each student xlWorkSheet.Cells(i, 5).Formula = "=SUM($C{0}:$D{0})".Replace("{0}", i.ToString()).
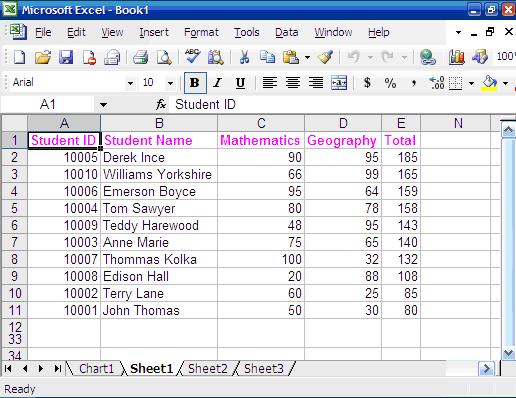
Figure 9. Excel Report having output the list of students and their respective marks.
A chart is also generated using the objects. The x-axis consists of the names and id of each student. The y-axis, the marks for the different students. The chart is always handy for analysis of data.
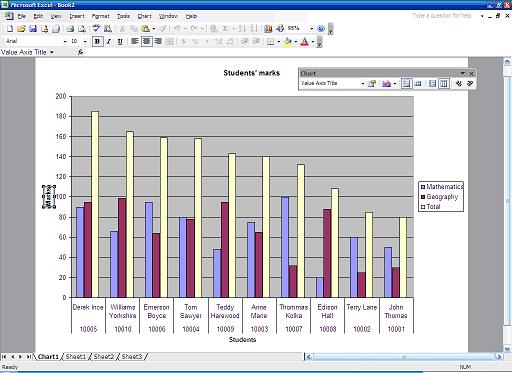
Figure 10. Chart that is generated using Microsoft Excel 11.0 Objects
'.net' 카테고리의 다른 글
| Rolling back Visual Studio 2008 projects to Visual Studio 2005 (1) | 2009.11.20 |
|---|---|
| Free Web DHTML Editor - FCKEditor 정리 (2) | 2008.05.16 |
| ADO.NET 2.0 DataSet as a Self-Contained (0) | 2008.04.18 |
| FCK editor No.2 (1) | 2008.04.04 |
| Tafiti Search Visualization (0) | 2008.03.07 |